

Plotting
Last updated on 2025-04-23 | Edit this page
Overview
Questions
- How can I visualise my data to explore it and gain insights?
- What types of plot does MATLAB support?
Objectives
- Demonstrate how to create plots in MATLAB that have titles, labelled axis and multiple lines
- Understand how to use line styles and markers to make plots clearer
Plot Function
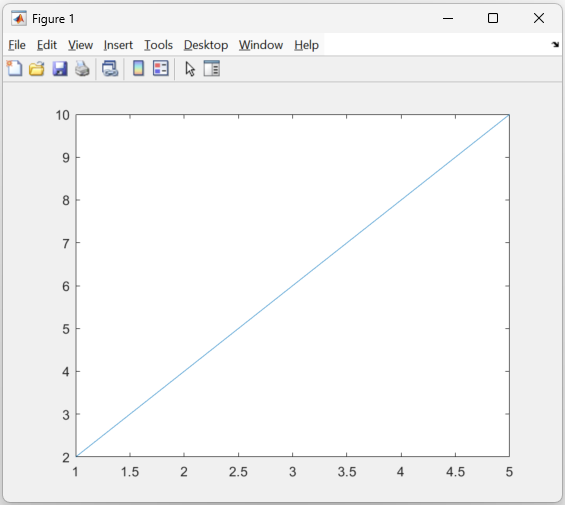
MATLAB has an inbuilt function called plot that creates
2-D line plots. We will start by exploring how to use this function to
get used to the plotting syntax of MATLAB and how we can explore
figures.
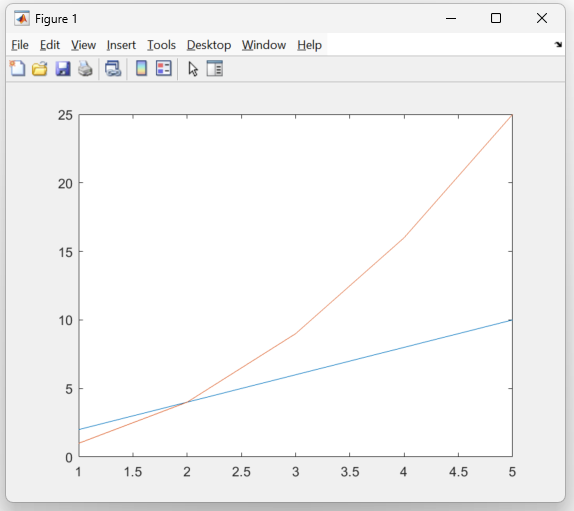
hold on
To add another line to the same plot we can use the hold on command, this will retain the current figure when adding new plots.
hold on
Create another vector variable called y2 with values 1, 4, 9, 16, 25
Plot x against y1 then x against y2 without hold on, what happens?
Plot x against y1, then
hold on, then x against y2, what’s different?
You should only see the y2 line, as the y1 figure was overwritten without
hold on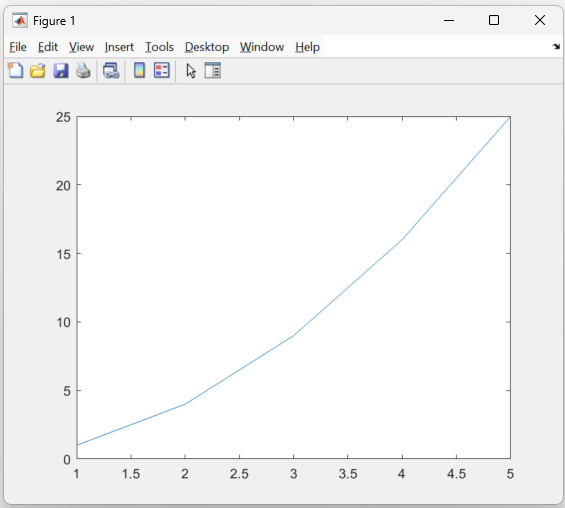
Now you should have both lines on the same plot
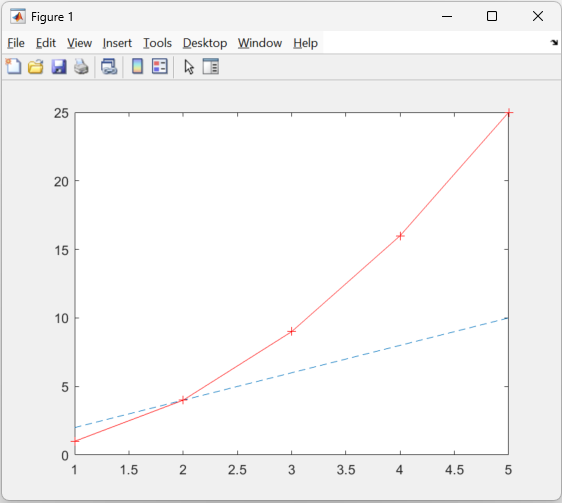
Line and Marker Styling
MATLAB offers a range of line colours and markers which can help distinguish lines or theme them.
Here are links to the line style and plot colour guides.
Styled plots
Close any currently open figures and use the guides above to plot the following lines:
- Plot y1 against x with a dashed line
- Plot y2 against x using a red solid line with plus markers
There are many other 2D plot types available in MATLAB which mostly
use a very similar syntax to plot, such as:
bar, histogram, scatter, heatmap and more. The full list can be found here
Figure Labelling
Titles, axis labels and legends are useful tools to make your plots more readable, and are essential to a plot if it is being added to a paper or journal.
MATLAB
title('Comparison of 2 lines')

xlabel('X Numbers')
ylabel('Y Numbers')

legend('Straight', 'Exponential')
3D Plotting
Here we are going to use a MATLAB function called peaks, which is a useful function for demonstrating 3D figures. It generates a matrix containing peaks obtained from a Gaussian distribution.
z = peaks(50);
surf(z)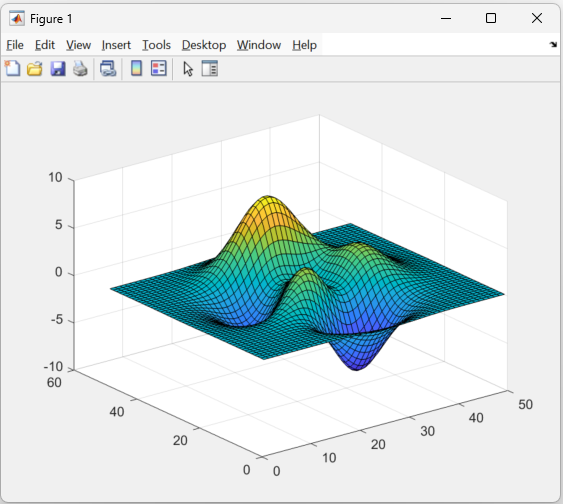
- Figures in MATLAB are by default interactive
- Hold on is needed to place multiple plots on the same figure
- Label and title your plots for extra clarity